Related
Looking for similar templates?
Check out these similar, fully customizable, templates. Includes a downloadable Spreadsheet.

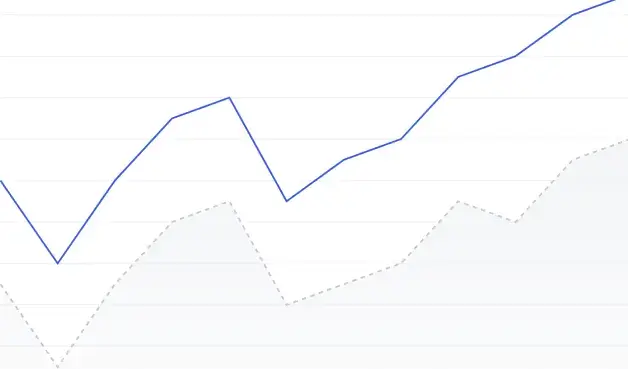
Revenues vs Expenses
Compare company revenues against their incumbent expenses to analyze general profitability.
Revenues - Past vs Present
Compares historic revenues against current sales data

Traffic by Platform
Compare company traffic from different sources with this multi-layer area chart.
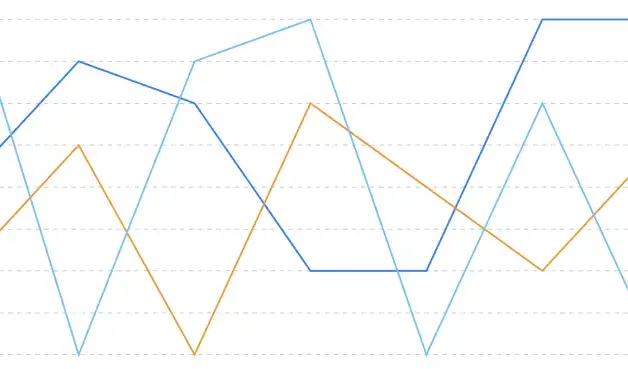
Social vs Search vs Referral
Compare company traffic by category in this multi-line chart.

Stock Portfolio Performance
Track the performance of multiple financial assets in this multi-line chart.
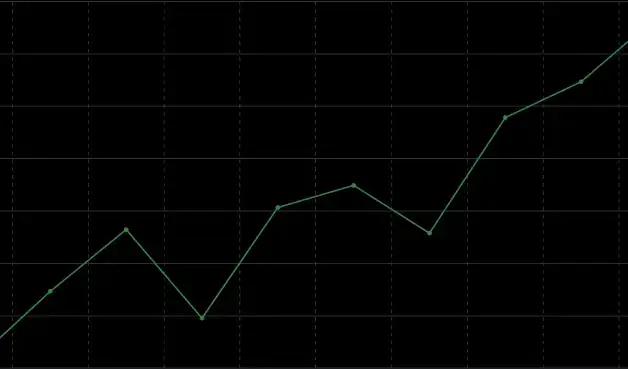
Historic Stock Price
Analyze the historic price of a stock or asset using this general purpose line chart.

Social Media Engagement
Visualize the ratio of engagement to impressions with this stacked area chart.